In this article I want to show you some examples of how a recruitment rate affects a deer population. I will show you some quantitative examples so you can see some actual numbers which is much easier to understand than just saying your deer population is going down or going up. I have found that this visual illustration gives people a much better understanding of how fawn recruitment affects their deer population and more importantly their deer harvest requirements.
First of all, what is Fawn Recruitment Rate?
Essentially, it is the percentage of fawns to does. (1 ½ year old does and older) You are trying to estimate how many fawns survive into the late summer and early fall and are thus successfully recruited into your deer population. It does not represent the total number of fawns that were dropped. The reason for this is because some fawns do not survive into the late summer and early fall. Predators and various health issues (be it disease, an unhealthy mother, still born, nutritional stress etc.) are some of the reasons some fawns die in the first several weeks of their lives. The purpose of the fawn recruitment rate is to give you a factor or percentage that you can use to estimate how many fawns are being successfully added to your deer population each season. It also allows you to compare your recruitment rate to other areas.
How can you estimate your Fawn Recruitment Rate?
I believe the most accurate methods are observation counts and trail camera surveys. I encourage everyone to do their survey as late in the year as they can but prior to the harvesting of any deer. When fawns are first dropped they can remain in hiding for several days so if you do a count in the summer there may still be some fawns not moving around with their mother. Where I hunt in Georgia I do my camera survey starting around the end of September. Let me briefly describe the two methods I mentioned above.
Observation counts: If you and some of your co-hunters are able to spend time on your property just before your hunting season opens then you can count how many does and fawns you see. An agricultural crop or a food plot is a great place to count deer since they are attractive food sources for deer. Don’t expect to go out one afternoon and get a count and use those results for your estimate. You should have a few different people covering a few different areas over a few different days. This will give you enough data to come up with some good estimates. Because many hunters don’t have much time available to do enough observation counts they usually end up doing a trail camera survey.
Trail Camera Survey: In this method you will utilize trail cameras to count the total number of does and fawns that you see in your pictures. You are not trying to count individual does and fawns because that would be impossible. (Most does look the same to me) You are just getting a total count of does and fawns in your pictures. This can be done over a 2 to 3 week time frame. If it is legal for you to put out an attractant (like corn) this helps lure the deer to the camera sites so you can get a good census.
Whichever method you use or you can even use a combination of both methods, you will divide the number of fawns counted by the number of does counted to come up with your own estimated fawn recruitment rate. Here are a couple of quick examples:
783 fawns / 1624 does = .48 recruitment rate
783 fawns / 975 does = .80 recruitment rate
I will now use my formula for “Deer Population and Harvest Estimate” to illustrate to you how different recruitment rates can drastically affect your deer population and harvest requirements. In each example I am assuming that there are approximately 30 different resident Bucks on this property and that there is a Doe to Buck ratio of 2:1. The size of this property is irrelevant for the purposes of this illustration. It could be a 500 acre tract or a 2000 acre tract. The important thing is that we are trying to maintain approximately 30 different Bucks and approximately a 2:1 Doe to Buck ratio for all three scenarios below.
In this first example I am using a recruitment rate of .40
(Click on pictures to enlarge.)
In the example above I want to point out that we have approximately 60 does. This is determined by taking our 30 different Bucks x 2 (our Doe to Buck ratio) When we apply our recruitment rate of .40 x our number of does it equates to 24 fawns. Using these 3 factors we have approximately 114 deer on this property.
We will be recruiting approximately 24 more deer into the deer population next hunting season. I have also indicated a 10% mortality rate for does and a 20% mortality rate for bucks. (Your rates may be higher or lower) This represents the number of does and bucks we expect to lose from other natural causes. (Disease, winter kill, fighting, hit by car, etc.) Please note that we are estimating our harvest requirements at 5 does and 4 bucks for a total of 9 deer. As a result of these harvests and the natural mortality we should keep approximately the same number of deer on this property. (114 deer)
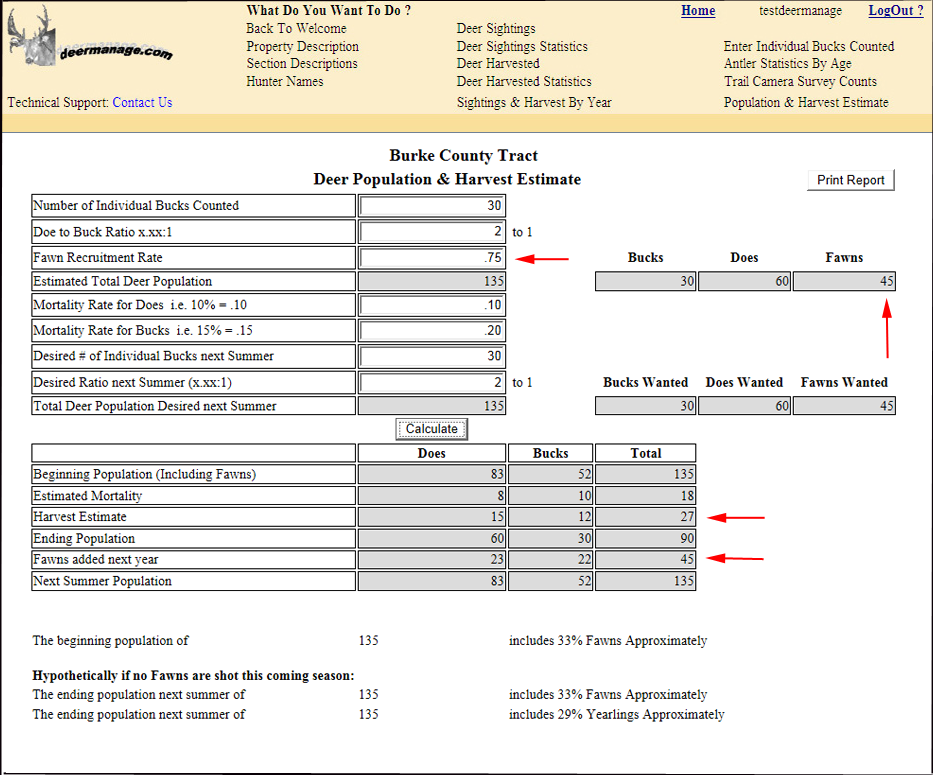
In the next example I am using a recruitment rate of .75
In the example above I want to point out that we still have approximately 60 does and 30 different bucks. When we apply our recruitment rate of .75 it equates to 45 fawns. It also means that our deer population is approximately 135 deer. (This is higher because of the higher recruitment) We will be recruiting approximately 45 more deer into the deer population next hunting season. This is 21 more deer than when we had a .40 recruitment rate. (An 88% increase in the number of fawns added) I am still using a 10% mortality rate for does and a 20% mortality rate for bucks. Because of the higher recruitment rate our harvest estimate now goes up to 15 does and 12 bucks for a total of 27 deer. Again, in this example we are simply trying to keep our deer population the same as it was at the beginning of the season. (Approximately 135 deer)
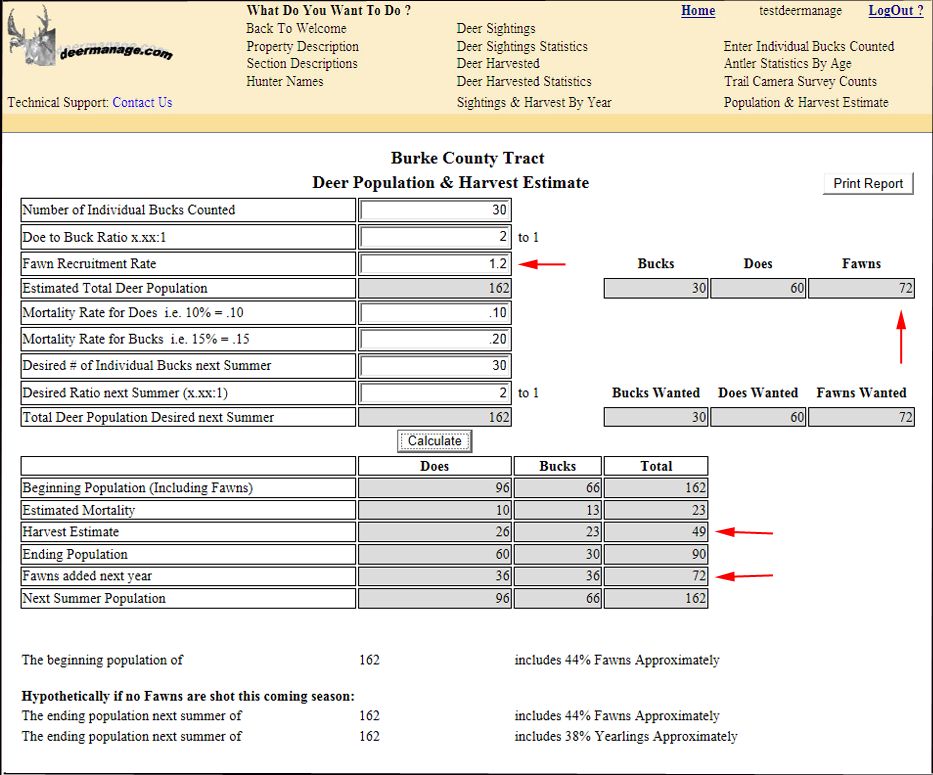
In the next example I am using a recruitment rate of 1.20
In the example above I want to point out that we still have approximately 60 does and 30 different bucks. When we apply our recruitment rate of 1.20 it equates to 72 fawns. It also means that our deer population is approximately 162 deer. (This is higher because of the higher recruitment) We will be recruiting approximately 72 more deer into the deer population next hunting season. This is 48 more deer than when we had a .40 recruitment rate. (200% increase in the number of fawns added) It is 27 more deer than when we had a .75 recruitment rate. (60% increase in the number of fawns added) I am still using a 10% mortality rate for does and a 20% mortality rate for bucks. Because of the higher recruitment rate our harvest estimate now goes up to 26 does and 23 bucks for a total of 49 deer. Again, in this example we are simply trying to keep our deer population the same as it was at the beginning of the season. (Approximately 162 deer)
In the 3 examples above I have shown you how 60 does can recruit a varying number of fawns into a deer population. It all depends on the properties or areas own specific fawn recruitment. Fawn recruitment rates not only vary within a state, they vary within a county. Stop depending on the state to tell you what your recruitment rate is on your own property because they can’t unless they are doing the specific surveys I mentioned above on your property. The state wildlife agencies do their best to establish Buck and Doe limits as well as hunting dates but when the dynamics can be so different on properties throughout the state it is a difficult task. (Please read my article “State Deer Biologists have a difficult task“ )
Recruitment rates can vary for a number of reasons. I will just give you a couple of the reasons.
- Are doe fawns successfully bred on your property or in your area? This can definitely be a contributing factor for a higher recruitment rate. On properties where doe fawns are not bred, next season you will be counting them as a doe (1 ½ year old) but there will be no fawn(s) with them. On the other hand if doe fawns are being bred, next season you will be counting them as a doe (1 ½ year old) and there will be a fawn(s).
- Predators The number of predators you have on your property or in your area can definitely influence your fawn survival.
- Overall health of your deer population.
I feel fortunate that we have a recruitment rate of approximately .75 because I believe our state uses an average of .60 for their estimates. I hear many hunters complain about their declining deer populations but when I ask them if they keep any records they simply reply that they don’t need to keep records because they KNOW that they are seeing fewer deer. I clearly remember feeling the same way until we started keeping records and we were truly humbled when the records disproved what we thought (or should I say what we KNEW) You will be surprised at what you can learn about your property and it’s deer population by doing a trail camera survey or keeping observation counts. If you also keep track of all of the deer harvested on your property then you will know with certainty if the dynamics of your own deer population is changing or remaining stable.
In summary, I hope I have shown you why it’s important to know your approximate recruitment rate on your property or in your area. You should keep track of this season by season so you will see if your recruitment rate is changing or remaining stable. Utilizing our software we know what our recruitment rate has been for the last several years and if we have a problem with it we will have the documentation to prove it. If we see our recruitment rate changing then by using the formula above we will adjust our harvests accordingly. In my next article I will be reviewing the pros and cons of having a low recruitment rate and a high recruitment rate.


