Many hunters feel that you change your Doe to Buck ratio by just shooting a bunch of does. It’s plain and simple, right? Not necessarily. I remember many years ago when we knew that our doe to buck ratio was very high and that it was making our buck hunting more difficult. We knew that we needed to shoot a bunch of does but we had no way of determining how many we should actually shoot. So we did what most hunters do today, we guessed. It was at that point that I came up with the formula that helps us establish our harvest estimates.
So, in this article I am going to cover how you can manipulate your Doe to Buck ratio. I will also talk about why you may want to manipulate your Doe to Buck ratio. I like asking other hunters what the Doe to Buck ratio is on the property that they hunt. I would say that 95% of the time they indicate what they think it is but when I ask them how they determined what it is, they confidently say that it’s based on what they are seeing while they are hunting. I ask them if they write anything down, but usually the response is that they don’t need to write anything down. They just know what they are seeing. Our memories are a wonderful thing but to determine the dynamics of your deer population which includes your Doe to Buck ratio, you can’t depend on memories. It’s amazing how your last hunt or two can strongly influence your thoughts. I could ask each individual member of a hunt club what they think their Doe to Buck ratio is and I will probably get a different estimate from each hunter.
How can you estimate your Doe to Buck ratio?
I believe the most accurate methods are trail camera surveys and observation counts. I encourage everyone to do their survey as late in the year as they can but prior to the harvesting of any deer. Where I hunt in Georgia I do my camera survey starting around the end of September. Let me briefly describe the two methods I mentioned above.
Trail Camera Survey: In this method you will utilize trail cameras to count the total number of does and bucks that you see in your pictures. You are not trying to count individual does and bucks for this process. (Most does look the same to me) You are just getting a total count of does and bucks in your pictures. This can be done over a 2 to 3 week time frame. If it is legal for you to put out an attractant (like corn) this helps lure the deer to the camera sites so you can get a good census.
Observation counts: If your deer (especially bucks) are pretty much nocturnal then you won’t be able to use observation counts to estimate your doe to buck ratio. But, if your deer do move around some in the morning or a bit before dark then you may be able to get a good census using your observation counts. If you and some of your co-hunters are able to spend time on your property just before your hunting season opens then you can count how many does and bucks you see. An agricultural crop or a food plot is a great place to count deer since they are attractive food sources for deer. Don’t expect to go out one afternoon and get a count and use those results for your estimate. You should have a few different people covering a few different areas over a few different days. This will give you enough data to come up with some good estimates. Because many hunters don’t have much time available to do enough observation counts or because their deer are pretty much nocturnal they usually end up doing a trail camera survey which is just fine.
Whichever method you use or you can even use a combination of both methods, you will divide the number of does counted by the number of bucks counted to come up with your own estimated doe to buck ratio. Here are a couple of quick examples:
1751 does / 738 bucks = 2.37 doe to buck ratio
1751 does / 917 bucks = 1.91 doe to buck ratio
I will now use my formula for “Deer Population and Harvest Estimate” to illustrate to you how different doe to buck ratios can affect your harvest requirements. I will show you how the number of does and bucks to be harvested is calculated based on the estimated doe to buck ratio you have before the season and the approximate doe to buck ratio you would like to have next season. In each example I am assuming that there are approximately 30 different resident Bucks on this property and that there is approximately a .70 fawn recruitment rate. The size of this property is irrelevant for the purposes of this illustration. It could be a 500 acre tract or a 2000 acre tract. The important thing is that we are starting with approximately 30 different Bucks and approximately a .70 recruitment rate for all the examples below. (Remember, resident Bucks are Bucks that spend most of their time on your property.)
Please note that the Doe to Buck ratio at the top of the formula is calculated excluding fawns. We are determining the ratio based on deer that are 1 year old and older. When we do observation counts and camera surveys we count fawns strictly as fawns and we don’t try to identify them as doe fawns or buck fawns. For those of you that would like to see the Doe to Buck ratio including fawns we show that estimate at the bottom part of the formula. We do assume that ½ of the fawns will be Does and ½ will be Bucks. Though this may not necessarily be the case each year, over time it is probably close to a 50:50 split.
(Click on pictures to enlarge.)
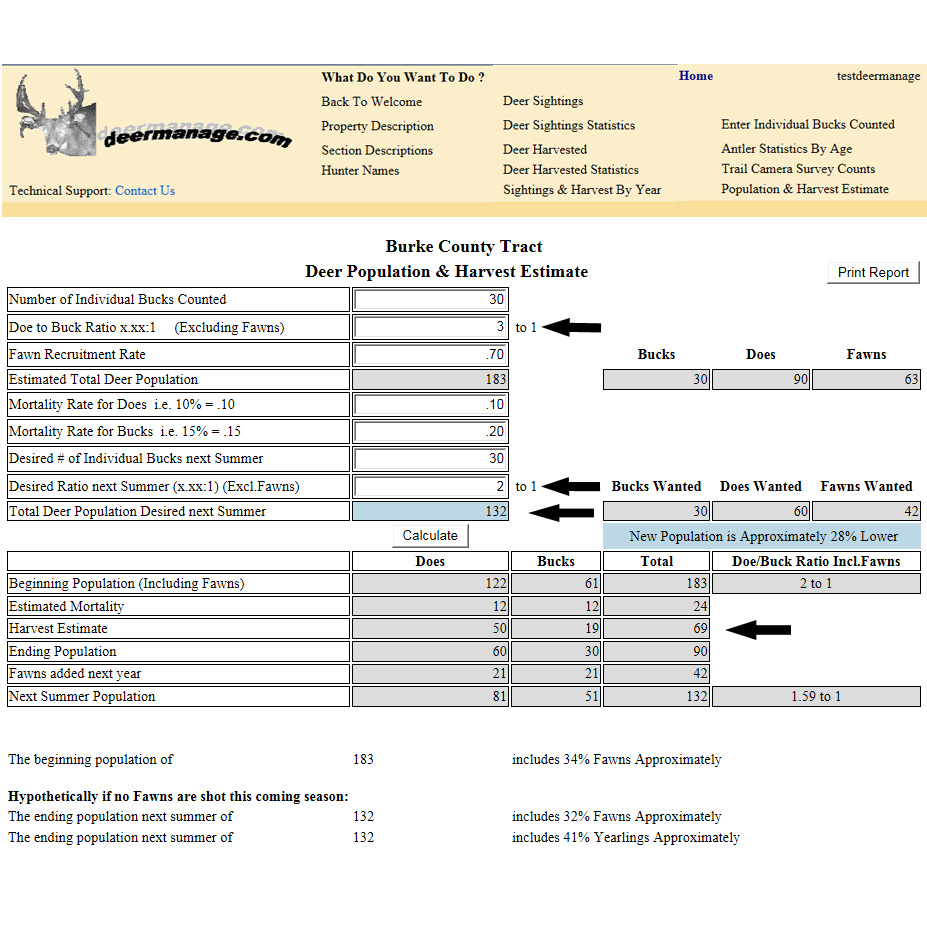
In the example above I am starting with approximately a 3 to 1 doe to buck ratio and I am purposely trying to get it down to approximately a 2 to 1 doe to buck ratio next season. If I try to keep the same number of bucks (30) and just try to reduce the doe to buck ratio please take note of how the deer population will go from approximately 183 deer down to approximately 132 deer. This is a decrease in the deer population of approximately 28%. If lowering the deer population is my intentions then this is fine. By using a mortality rate of 10% for does and 20% for bucks (your rates may be higher or lower) we estimate that we will lose 12 does and 12 bucks to natural mortality. (Disease, predators, winter kill, fighting, hit by car, etc.) After this, we estimate that we should harvest 50 does and 19 bucks for a total of 69 deer. It’s obvious to see that we need to shoot a lot more does than bucks but we are still going to shoot some bucks. These estimates will allow us to reduce our doe to buck ratio from 3 to 1 down to 2 to 1 and at the same time lower our deer population by approximately 28%.
If my intentions are not to lower the deer population but to keep the population about the same then look at the next example.
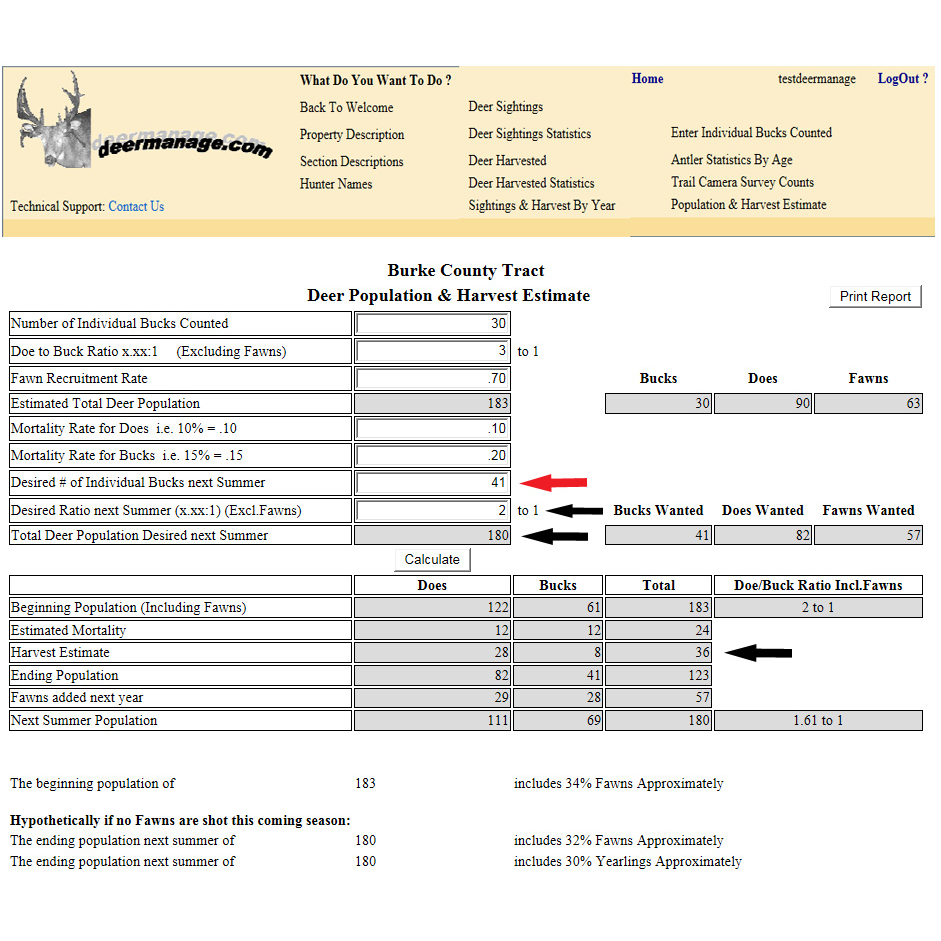
In the example above please note that we are starting with the same deer population as in the first example. But notice that next season I have not only indicated that I want to have approximately a 2 to 1 doe to buck ratio but I also indicated that I wanted to have approximately 41 bucks. By increasing the number of bucks on the property I can now keep our deer population around 180 deer and we can have the doe to buck ratio closer to 2 to 1. The estimated mortality stays the same but look at the new harvest estimates. Instead of harvesting approximately 50 does and 19 bucks we will harvest approximately 28 does and 8 bucks. This will not only bring our doe to buck ratio down to approximately 2 to 1, it will also keep our deer population around 180 deer!
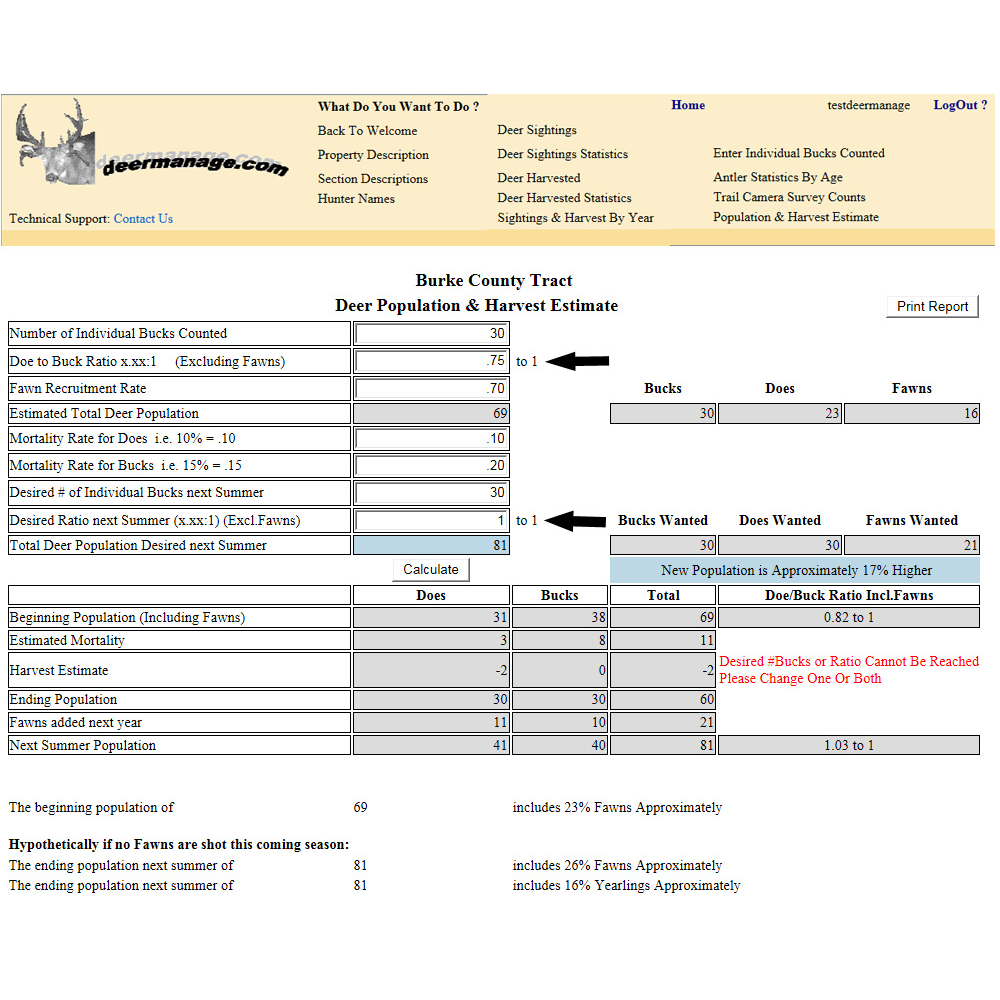
In the next example I am showing a property that actually has more Bucks than Does. They actually have 3 Does for every 4 Bucks. When I divide 3 by 4 I come up with .75 which is the Doe to Buck ratio that I use below.
In the example above I tried to bring up the Doe to Buck ratio to 1 to 1. The Harvest Estimate is telling me that I can’t really reach that ratio successfully this season. I should harvest no Bucks and no Does but it’s indicating a -2 under Doe Harvests which is telling me I need to bring in 2 more Does which is not an option. I’ll just have to harvest no deer this season and then try to reach my goals next season.
There isn’t a perfect doe to buck ratio that applies to every property out there. Some properties like to keep a tight doe to buck ratio because it may improve their Buck hunting. Other properties may need to keep a higher doe to buck ratio in order to maintain their deer population and/or allow them to harvest a certain number of deer. Let me give you 3 more examples so I can show you what I mean.
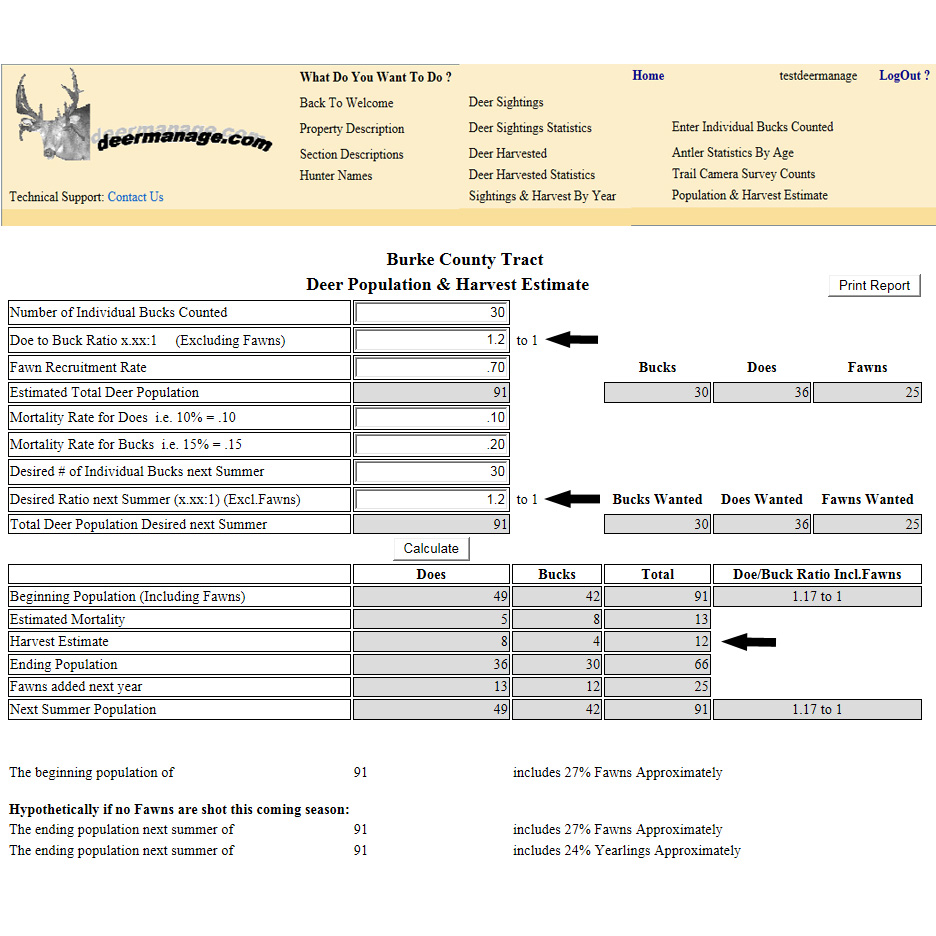
In the example above the property has a pretty tight doe to buck ratio of approximately 1.2 to 1. They also have a mortality rate of about 10% for does and 20% for bucks. These hunters are completely satisfied with their hunting and can shoot approximately 8 does and 4 bucks each season.
But for another property (or even this property if things change) look at what happens if they actually have a higher mortality rate as shown below:
In the example above we now increased our mortality rates to 20% for does and 30% for bucks. In the previous example we could harvest approximately 8 does and 4 bucks but now with the higher mortality we can shoot 3 does and no bucks. (actually the buck population may decrease by 1) This is actually happening to some areas because of the increase in predators such as coyotes. The situation shown above is not acceptable to the hunt group so what should they do? Obviously they should do their best to reduce the predation but if they can’t they will have to increase their deer population. They will probably decide to shoot no deer until they can get the population up.
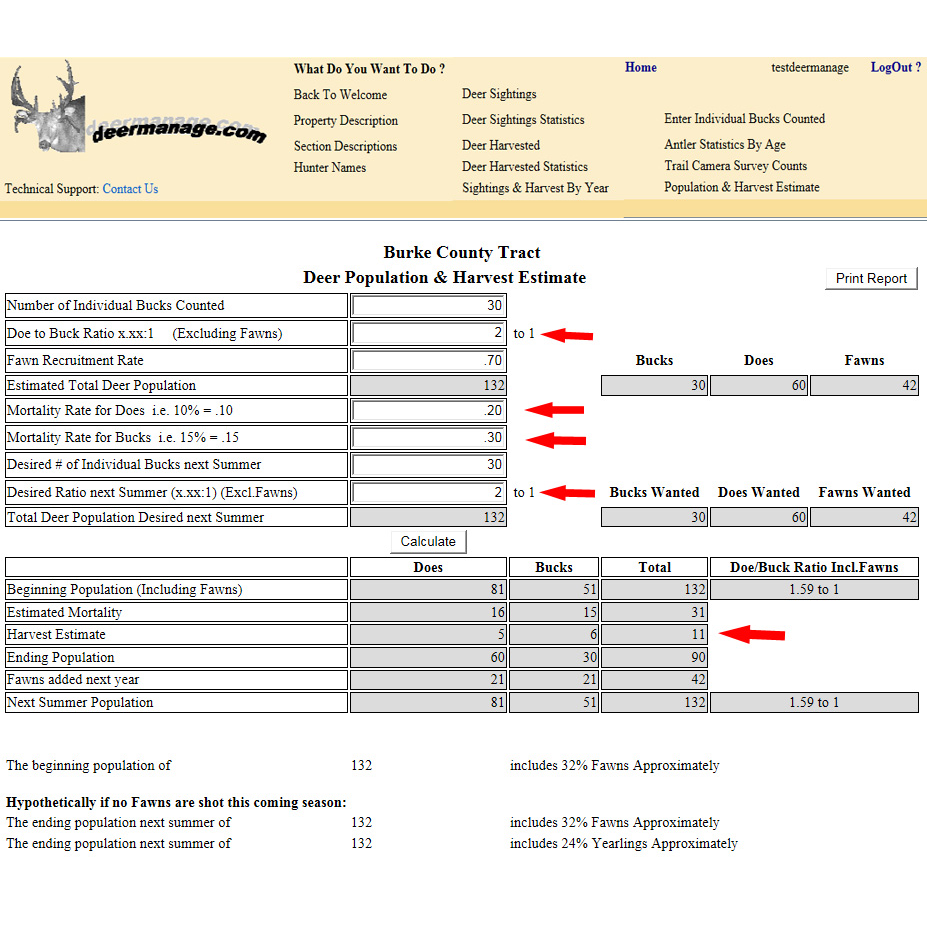
Let’s look at the next example:
In the example above we increase our doe to buck ratio to 2 to 1 which increases our deer population to approximately 132 deer. So with the higher mortality rates we will at least be able to harvest about 5 does and 6 bucks.
In summary, deer hunters and deer managers should educate themselves on the dynamics of the deer population on their property or in their area. This includes knowing the approximate doe to buck ratio. Even though smaller properties can estimate their doe to buck ratio, the larger the property the more accurate it will be. I prefer determining the dynamics of a deer population on an area that is 1000 or more acres. In many cases getting a few neighbors together can allow you to estimate your doe to buck ratio, fawn recruitment rate, etc. in your own area. As you see from just the 6 examples above there can be and are many variations in the dynamics of deer populations located not just from state to state or county to county but from property to property! We have a 1.3 to 1 doe to buck ratio and 5 miles away they may have a 2.5 to 1 doe to buck ratio.
So here’s the reality check. It’s time we all take responsibility for our own properties and areas. Let’s stop depending on or blaming our state wildlife divisions for deer population problems that may exist in different areas of a state. These state biologists have a difficult job because there is such a variation in the dynamics of the deer populations throughout the state. Just look at my examples above! All they can do is establish limits that will allow most all properties in the state to meet their own harvest requirements. If they establish a season limit of 2 bucks and 4 does that doesn’t mean that you have to go out and shoot 2 bucks and 4 does. Each hunt club or group should try to monitor their own deer harvests season by season so there is clear documentation on what is happening on their own specific property. If they can also keep track of their fawn recruitment rate and maybe even do a trail camera survey then that’s even better. It takes us about 30 seconds to write down the information of a deer we harvest. It also takes about 30 seconds to enter that information into a computer. So if you consider the amount of time (and money) you invest in your hunting then taking a minute to record some information on each deer that is harvested is a small investment of time for actual documentation of your deer harvests season by season on your own hunting property. Know with certainty if your deer harvests are going up or going down from season to season and try to monitor your Doe to Buck Ratio season to season.

